UNIT-3: Requirements Engineering (RE)
Requirements Engineering
Bridge to design and construction
RE tasks, initiating the RE process
Eliciting Requirements
Developing use cases
Building the analysis models
Negotiating and validating requirements.
Building the Analysis model:
Requirements analysis,
Analysis modeling approaches,
Data modeling concepts
OOA
Scenario-based modeling
Flow-oriented modeling
Class-based modeling,
Creating behavior model.
Requirements Engineering:
Requirements engineering (RE):
Refers to the process of Defining, Documenting, and Maintaining requirements
in the engineering design process. Requirements engineering provides the appropriate mechanism to understand the following
What the customer desires,
Analyzing the needs,
Assessing feasibility,
Negotiating a reasonable solution,
Specifying the solution clearly,
Validating (officially acceptable) the specifications and
Managing the requirements as they are transformed into a working
System So the requirement engineering is the disciplined application of proven
Principles, methods, Tools, and notation to describe a proposed system's
Intended behavior and its associated constraints
Requirement Engineering Process:
Requirement Engineering Process is a five-step process, which includes –
Feasibility Study
Requirement Elicitation and Analysis
Software Requirement Specification
Software Requirement Validation
Software Requirement Management.
Requirement Engineering Process is shown in the figure
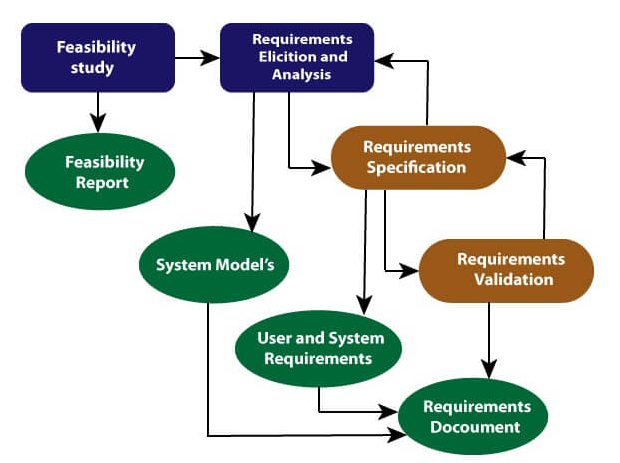
1. Feasibility Study: A feasibility study is an analysis that takes all of a
Project’s relevant factors into account—including economic, technical, legal,
and scheduling considerations to ascertain the likelihood of completing the
Project successfully.
The objective behind the feasibility study is to create the reasons for developing
the software that is acceptable to users, flexible to change and conformable to
Established standards
Types of Feasibility:
Technical Feasibility :
Technical feasibility evaluates the current technologies, which are needed to
Accomplish customer requirements within the time and budget.
Operational Feasibility :
Operational feasibility assesses the range in which the required software
Performs a series of levels to solve business problems and customer
Requirements
Economic Feasibility :
Economic feasibility decides whether the necessary software can generate
Financial profits for an organization.
II. Requirement Elicitation and Analysis:
Elicitation means getting information from someone.
This is also known as the gathering of requirements. Here, requirements are
Identified with the help of customers and existing systems
Analysis of requirements starts with requirement elicitation.
The requirements are analyzed to identify inconsistencies, defects, omission,
etc. We describe requirements in terms of relationships and also resolve
Conflicts
Problems of Elicitation and Analysis
Stakeholders often don't know what they want
Stakeholders express requirements in their terms.
Stakeholders may have conflicting requirements.
Requirement change during the analysis process.
Organizational and political factors may influence system requirements.
III. Software Requirement Specification:
Software requirement specification is a kind of document which is created by
Software analyst after the requirements collected from the various sources - the
Requirement received by the customer written in ordinary language. It is the job
Of the analyst to write the requirement in technical language so that they can be
Understood and beneficial by the development team
The models used at this stage include Data flow Diagrams (DFDs), Function
Decomposition Diagrams (FDDs), Entity Relation (ER) diagrams, and Data
Dictionaries, etc
Data Flow Diagrams: Data Flow Diagrams (DFDs) are used widely
For modeling the requirements, DFD shows the flow of data through
A system, the system may be a company, an organization, a set of
Procedures, a computer hardware system, a software system, or any
Combination of the preceding, In DFD we have three levels
They are
Zero Level DFD
First Level DFD
Second Level DFD.
Consider one example for DFD: Online System Data flow Diagram.
In Zero Level DFD, we have elaborated the High level process of
Shopping system, it is a basic over view of the whole online
Shopping system, High level entities and process flow of online
Shopping system:
Managing all the shopping
Managing all the shopping Cart
Managing all the Order
Managing all the Payment
Managing all the shopping
Managing all the Product
Managing all the Delivery
Managing all the Confirm order
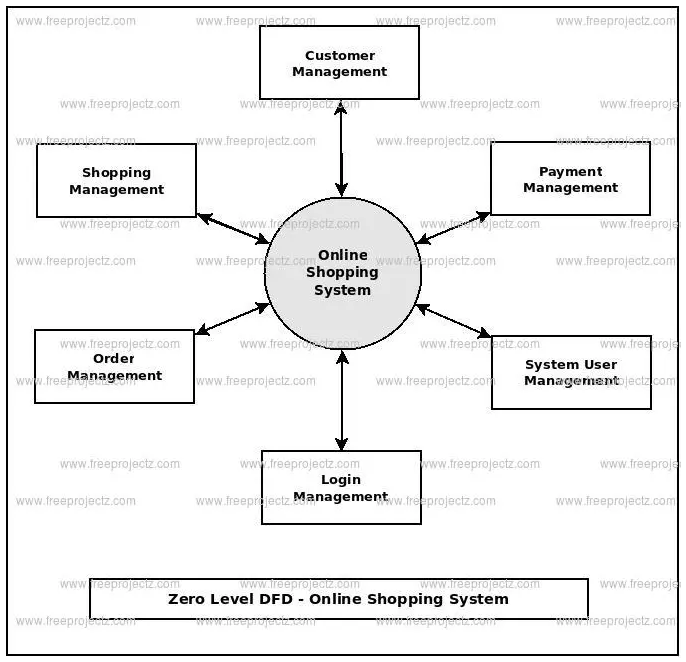
Here the Rectangle represents the External Entities (Source of Sink)
Circle represents the Process and Arrow represents the Data Flow
First Level Data Flow Diagram:
First level DFD of online Shopping System is divided into sub
Systems, each deal with one or more of the flows to or from an
External agent
Main Entities and output of First Level DFD:
Processing Shopping Records and generate report of all shopping
Processing shopping carat records and generates report of all shopping
Cart, processing order records and generates report for all order
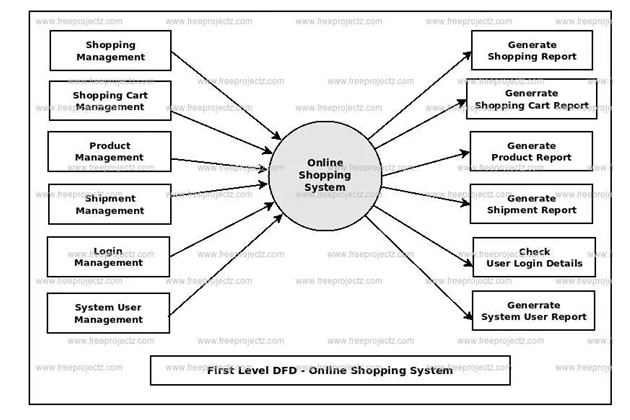
The DFD is also known as a data flow graph or bubble chart.
Second level Data Flow Diagram: DFD Level 2 goes one step
Deeper into parts of level 1of shopping system, it may require more
Functionalities of the Shopping system to reach the necessary level of
Details about the shopping system functioning. In the first level
System shows how the system is divided in to sub systems (Processes).
The second level DFD contains more details of system.
Low level functionalities of online shopping system:
Admin logins to the system and manage all the functionalities of
Online system

Data Dictionaries: Data Dictionaries are simply repositories to store
Information about all data items defined in DFDs. At the requirements
Stage, the data dictionary should at least define customer data items to
Ensure that the customer and developers use the same definition and
Terminologies
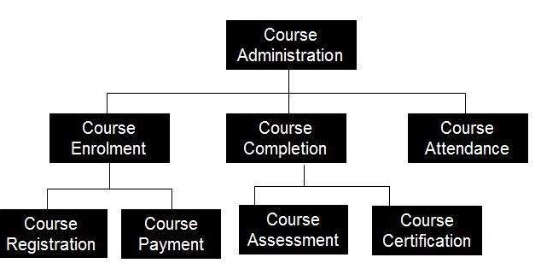
Function Decomposition Diagram: Large or complex functionalities
are more easily understood, when broken down into pieces using
Functional decomposition, It mainly focuses on how the overall
Functionality is developed and its interaction between various
Components
Ex Course administration Process:
Entity-Relationship Diagrams: Another tool for requirement
Specification is the Entity-relationship diagram, often called an "E-R
Diagram" It is a detailed logical Representation of the data for the
Organization and uses three main constructs i.e.
Data entities, relationships, and their associated attributes
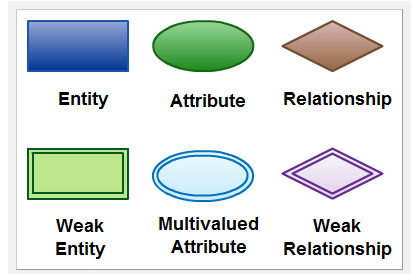
An Entity Relationship Diagram (ERD) is a visual representation of
Different data using conventions that describe how these data are
Related to each other For example, the elements writer, novel, and consumer may be described using ER diagrams in the following way

IV. Software Requirement Validation:
After requirement specifications developed, the requirements discussed in this
Document is validated. The user might demand illegal, impossible solution or
Experts may misinterpret the needs. Requirements can check against the
Following conditions -
If they can practically implement
If they are correct and as per the functionality and specially of software
If there are any ambiguities
If they are full
If they can describe
Requirements Validation Techniques
Requirements reviews/inspections: systematic manual analysis of the requirements
Prototyping: Using an executable model of the system to check requirements
Test-case generation: Developing tests for requirements to check testability
Automated consistency analysis: checking for the consistency of Structured requirements descriptions
V. Software Requirement Management:
Requirement management is the process of managing changing requirements.
During the requirements engineering process and system development,
New requirements emerge during the process as business needs a change, and a
Better understanding of the system is developed.
The priority of requirements from different viewpoints changes during
Development process, the business and technical environment of the system
Changes during the development.
Requirement Elicitation Process:
Requirement elicitation process can be depicted using the following diagram:

Requirements gathering - The developers discuss with the client and
End users to know their expectations from the software.
Organizing Requirements - The developers prioritize and arrange the
Requirements in the order of importance, urgency and convenience
Negotiation & discussion - If requirements are ambiguous or there are
some conflicts in requirements of various stakeholders, if they are, it is
then negotiated and discussed with stakeholders. Requirements may then
be prioritized and reasonably compromised. The requirements come from various
stakeholders. To remove the Ambiguity and conflicts, they are discussed for clarity
and correctness. Unrealistic requirements are compromised reasonably.
Documentation - All formal & informal, functional and non-functional
Requirements are documented and made available for next phase
Processing
Requirement Elicitation Techniques
Requirements Elicitation is the process to find out the requirements for an
Intended software system by communicating with client, end users, system
Users and others who have a stake in the software system development
There are various ways to discover requirements
Interviews
Interviews are strong medium to collect requirements. Organization may
Conduct several types of interviews such as:
Oral interviews
Written interviews
One-to-one interviews which are held between two persons across the table.
Group interviews which are held between groups of participants. They help to uncover any missing requirement as numerous people are involved.
Surveys
Organization may conduct surveys among various stakeholders by querying
about their expectation and requirements from the upcoming system.
Questionnaires
A document with pre-defined set of objective questions and respective options
is handed over to all stakeholders to answer, which are collected and compiled.
A shortcoming of this technique is, if an option for some issue is not mentioned
in the questionnaire, the issue might be left unattended.
Task analysis
Team of engineers and developers may analyze the operation for which the
New system is required. If the client already has some software to perform
Certain operation, it is studied and requirements of proposed system are
Collected
Domain Analysis
Every software falls into some domain category. The expert people in the
domain can be a great help to analyze general and specific requirements.
Brainstorming
An informal debate is held among various stakeholders and all their inputs are
recorded for further requirements analysis.
Prototyping
Prototyping is building user interface without adding detail functionality for
user to interpret the features of intended software product. It helps giving better
idea of requirements. If there is no software installed at client’s end for
developer’s reference and the client is not aware of its own requirements, the
developer creates a prototype based on initially mentioned requirements. The
prototype is shown to the client and the feedback is noted. The client feedback
serves as an input for requirement gathering.
Observation
Team of experts visit the client’s organization or workplace. They observe the
actual working of the existing installed systems. They observe the workflow at
client’s end and how execution problems are dealt. The team itself draws some
conclusions which aid to form requirements expected from the software.
Software Requirements Characteristics
Gathering software requirements is the foundation of the entire software
Development project, hence they must be clear, correct and well-defined.
A complete Software Requirement Specifications must be:
Clear
Correct
Consistent
Modifiable
Verifiable
Prioritized
Unambiguous
Traceable
Credible source
Software Requirements: Largely software requirements must be categorized
into two categories:
Functional Requirements: Functional requirements define a function that a system or system element must be qualified to perform and must be documented in different forms.
The functional requirements are describing the behavior of the system as it correlates to the system's functionality.
Functional requirements describe what the software should do.
Functional requirements are easy to test,
Related to the individual System features
Non-functional Requirements: This can be the necessities that specify the criteria that can be used to decide the operation instead of specific behaviours of the system.
Non-functional requirements are divided into two main categories:
Execution qualities like security and usability, which are observable at run time.
Describes the Storage requirements of the system.
Difficult to test
Evolution qualities like testability, maintainability, extensibility, and scalability that embodied in the static structure of the software system.
Non-functional requirements include -
Security
Logging
Storage
Configuration
Performance
Cost
Interoperability
Flexibility
Disaster recovery
Accessibility
Software Metrics and Measures:
Software Measures can be understood as a process of quantifying and
Symbolizing various attributes and aspects of software
Software Metrics provide measures for various aspects of software process and
Software product Software measures are fundamental requirement of software
engineering. They not only help to control the software development process but
also aid to keep quality of ultimate product excellent.
Let us see some software metrics:
Size Metrics - LOC (Lines of Code), mostly calculated in thousands of
Delivered source code lines, denoted as KLOC.
Function Point Count is measure of the functionality provided by the
Software. Function Point count defines the size of functional aspect of
Software
Complexity Metrics - McCabe’s Cyclomatic complexity quantifies the
Upper bound of the number of independent paths in a program, which is
Perceived as complexity of the program or its modules.,It is represented
in terms of graph theory concepts by using control flow graph.
Cyclomatic complexity = E - N + 2*P
Where
E = number of edges in the flow graph.
N = number of nodes in the flow graph.
P = number of nodes that have exit points
Quality Metrics - Defects, their types and causes, consequence, intensity
of severity and their implications define the quality of product.
The number of defects found in development process and number of
Defects reported by the client after the product is installed or delivered at
Client-end, define quality of product.
Process Metrics - In various phases of SDLC, the methods and tools
used, the company standards and the performance of development are
Software process metrics
Resource Metrics - Effort, time and various resources used, represents
metrics for resource measurement.
Developing use cases:
Use cases define interactions between external actors and the system to attain
Particular goals,
There are three basic elements that make up a use case:
Actors: Actors are the type of users that interact with the system.
System: Use cases capture functional requirements that specify the
Intended behavior of the system
Goals: Use cases are typically initiated by a user to fulfil goals describing
the activities and variants involved in attaining the goal.
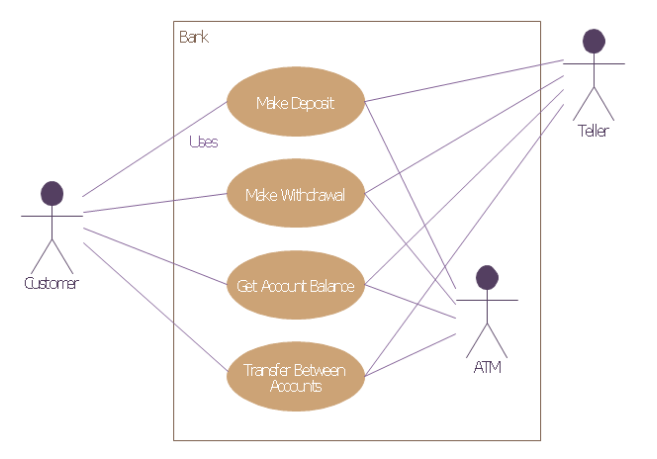
Use cases are modelled using unified modelling language and are represented
by ovals containing the names of the use case.
Actors are represented using lines with the name of the actor written below the
Line. To represent an actor's participation in a system, a line is drawn between the
Actor and the Use case Boxes around the use case represent the system boundary.
Characteristics associated with use cases are:
Organizing functional requirements
Modelling the goals of system user interactions
Recording scenarios from trigger events to ultimate goals
Describing the basic course of actions and exceptional flow of events
Permitting a user to access the functionality of another event
The steps in designing use cases are:
Identify the users of the system
For each category of users, create a user profile. This includes all roles played by
the users relevant to the system.
Identify significant goals associated with each role to support the system.
The system’s value proposition identifies the significant role.
Create use cases for every goal associated with a use case template and maintain
the same abstraction level throughout the use case. Higher level use case steps are
treated as goals for the lower level.
Structure the use cases Review and validate the users.
Example for use case diagram:
The advantages of Use cases:
The list of goal names provides the shortest summary of what the system will offer
It gives an overview of the roles of each and every component in the system.
It will help us in defining the role of users, administrators etc.
It helps us in extensively defining the user’s need and exploring it as to how it will work.
It provides solutions and answers to many questions that might pop up if we start a project unplanned.
Building the analysis models:
Analysis model operates as a link between the 'system description' and the
'design model'.
In the analysis model, information, functions and the behaviour of the system is defined and these are translated into the architecture, interface and component level design in the 'design modelling'.
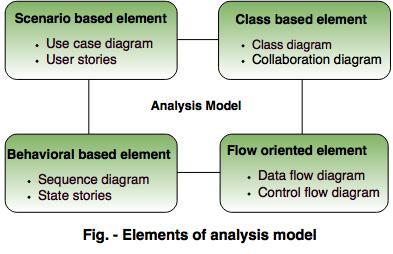
Elements of the analysis model:
1. Scenario based element
This type of element represents the system user point of view.
Scenario based elements are use case diagram, user stories.
2. Class based elements
The object of this type of element manipulated by the system.
It defines the object, attributes and relationship.
The collaboration is occurring between the classes.
Class based elements are the class diagram, collaboration diagram.
3. Behavioural elements
Behavioural elements represent state of the system and how it is changed by the external events.
The behavioural elements are sequenced diagram, state diagram.
4. Flow oriented elements
An information flows through a computer-based system it gets transformed.
It shows how the data objects are transformed while they flow between the various system functions.
The flow elements are data flow diagram, control flow diagram.
The rules are as follows:
The model focuses on the requirements in the business domain. The level of abstraction must be high i.e there is no need to give details.
Every element in the model helps in understanding the software requirement and focus on the information, function and behaviour of the system.
The consideration of infrastructure and non-functional model delayed in the design.
Throughout the system minimum coupling is required. The interconnections between the modules are known as 'coupling'.
The analysis model gives value to all the people related to model.
The model should be simple as possible. Because simple model always helps in easy understanding of the requirement.
Analysis modeling approaches:
Analysis Model:
It is a technical representation of the system. It acts as a link between system description and design model. In Analysis Modelling, information, behavior and functions of the system is defined and translated into the architecture, component and interface level design in the design modelling.
Objectives of Analysis Modelling:
It must establish a way of creation of software design.
It must describe requirements of customer.
It must define set of requirements which can be validated, once the software is built.
Elements of Analysis Model:
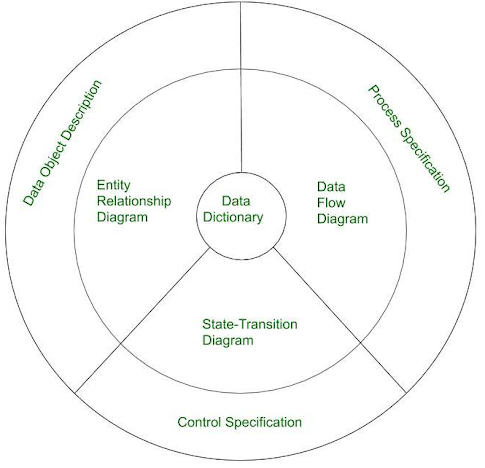
Data Dictionary:
It is a repository that consists of description of all data objects used or produced by software. It stores the collection of data present in the software. It is a very crucial element of the analysis model. It acts as a centralized repository and also helps in modelling of data objects defined during software requirements.
Entity Relationship Diagram (ERD):
It depicts relationship between data objects and used in conducting of data modelling activity. The attributes of each object in the Entity Relationship Diagram can be described using Data object description. It provides the basis for activity related to data design.
Data Flow Diagram (DFD):
It depicts the functions that transform data flow and it also shows how data is transformed when moving from input to output. It provides the additional information which is used during the analysis of information domain and serves as a basis for the modelling of function. It also enables the engineer to develop models of functional and information domain at the same time.
State Transition Diagram:
It shows various modes of behavior (states) of the system and also shows the transitions from one state to other state in the system. It also provides the details of how system behaves due to the consequences of external events. It represents the behavior of a system by presenting its states and the events that cause the system to change state. It also describes what actions are taken due to the occurrence of a particular event.
Process Specification:
It stores the description of each functions present in the data flow diagram. It describes the input to a function, the algorithm that is applied for transformation of input, and the output that is produced. It also shows regulations and barriers imposed on the performance characteristics that are applicable to the process, and layout constraints that could influence the way in which the process will be implemented.
Control Specification:
It stores the additional information about the control aspects of the software. It is used to indicate how the software behaves when an event occurs and which processes are invoked due to the occurrence of the event. It also provides the details of the processes which are executed to manage events.Data Object Description:
It stores and provides the complete knowledge about a data object present and used in the software. It also gives us the details of attributes of the data object present in Entity Relationship Diagram. Hence, it incorporates all the data objects and its attributes.
Requirements Analysis
Basically software requirement is a Functional or Non-functional
Software requirement is a functional or non-functional need to be
Implemented in the system
Functional means providing particular service to the user.
Software requirement can also be a non-functional; it can be a
Performance requirement
Types of Requirements:
Business requirements: They are high-level requirements that are taken from
the business case from the projects.
For example, a mobile banking service system provides banking services to
USA. The business requirement that is decided for India is account summary
and fund transfer while for USA account summary and bill payment is decided
as a business requirement.
Architectural and Design requirements: These requirements are more
Detailed than business requirements, It determines the overall design required
to implement the business requirement.
For our Banking organization the architectural and design use cases would be
Login, Bill Payment details etc. The requirement would be as shown below.
System and Integration requirements:
At the lowest level, we have system and integration requirements. It is detailed
description of each and every requirement. It can be in form of user stories
which is really describing everyday business language. The requirements are in
abundant details so that developers can begin coding.
Here in example of Bill Payment module where requirement will be mentioned
for adding a Biller.
Other Sources of Requirements:
Knowledge transfer from colleagues or employees already working on that project
Talk about project to business analyst, product manager, project lead and developers
Analyze previous system version that is already implemented into the system
Analyze the older requirement document of the project
Look into the past Bug reports, some of the bug reports are turned into enhancement request which may be implemented into current version
Look into installation guide if it is available to see what are the installation required
Analyze the domain or industry knowledge that team is trying to implement
Data modeling concepts
Analysis modelling starts with the data modelling.
The software engineer defines all the data object that proceeds within the system and the relationship between data objects are identified.
Data objects
The data object is the representation of composite information.
The composite information means an object has a number of different properties or attribute.
For example, Height is a single value so it is not a valid data object, but dimensions contain the height, the width and depth these are defined as an object.
Data Attributes
Each of the data object has a set of attributes.
Data object has the following characteristics:
Name an instance of the data object.
Describe the instance.( Occurrence of an event)
Make reference to another instance in another table.
Relationship
Relationship shows the relationship between data objects and how they are
related to each other.
Cardinality
Cardinality state the number of events of one object related to the number of events of another object.
The cardinality expressed as:
One to one (1:1)
One event of an object is related to one event of another object.
For example, one employee has only one ID.
One to many (1:N)
One event of an object is related to many events.
For example, one collage has many departments.
Many to many (M:N)
Many events of one object are related to many events of another object.
For example, many customer place order for many products
Object Oriented Analysis (OOA):
Object Oriented Analysis (OOA) is the first technical activity performed as part of object oriented software engineering. OOA introduces new concepts to investigate a problem. It is based in a set of basic principles, which are as follows-
The information domain is modelled.
Behavior is represented.
Function is described.
Data, functional, and behavioural models are divided to uncover greater detail.
Early models represent the essence of the problem, while later ones provide implementation details of the three analysis techniques that are used in conjunction with each other for object-oriented analysis.
They are
Object modeling
Dynamic modeling
Functional modeling
Object Modelling
Object modelling develops the static structure of the software system in terms of objects. It identifies the objects, the classes into which the objects can be grouped into and the relationships between the objects. It also identifies the main attributes and operations that characterize each class.
The process of object modelling can be visualized in the following steps −
Identify objects and group into classes
Identify the relationships among classes
Create user object model diagram
Define user object attributes
Define the operations that should be performed on the classes
Review glossary
Dynamic Modelling
After the static behavior of the system is analyzed, its behavior with respect to time and external changes needs to be examined. This is the purpose of dynamic modelling.
Dynamic Modelling can be defined as “a way of describing how an individual object responds to events, either internal events triggered by other objects, or external events triggered by the outside world”.
The process of dynamic modelling can be visualized in the following steps −
Identify states of each object
Identify events and analyze the applicability of actions
Construct dynamic model diagram, comprising of state transition diagrams
Express each state in terms of object attributes
Validate the state–transition diagrams drawn.
The dynamic model represents the time–dependent aspects of a system. It is concerned with the temporal changes in the states of the objects in a system. The main concepts are −
State, which is the situation at a particular condition during the lifetime of an object.
Transition, a change in the state
Event, an occurrence that triggers transitions
Action, an uninterrupted and atomic computation that occurs due to some event, and
Concurrency of transitions.
A state machine models the behavior of an object as it passes through a number of states in its lifetime due to some events as well as the actions occurring due to the events. A state machine is graphically represented through a state transition diagram.
States and State Transitions
State
The state is an abstraction given by the values of the attributes that the object has at a particular time period. It is a situation occurring for a finite time period in the lifetime of an object, in which it fulfils certain conditions, performs certain activities, or waits for certain events to occur. In state transition diagrams, a state is represented by rounded rectangles.
Parts of a state
Name − A string differentiates one state from another. A state may not have any name.
Entry/Exit Actions − It denotes the activities performed on entering and on exiting the state.
Internal Transitions − The changes within a state that do not cause a change in the state.
Sub–states − States within states.
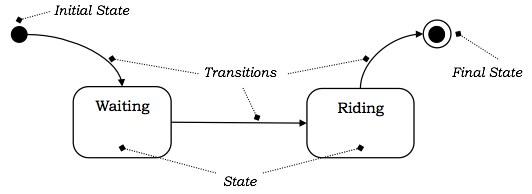
Initial and Final States
The default starting state of an object is called its initial state. The final state indicates the completion of execution of the state machine. The initial and the final states are pseudo-states, and may not have the parts of a regular state except name. In state transition diagrams, the initial state is represented by a filled black circle. The final state is represented by a filled black circle encircled within another unfilled black circle.
Transition
A transition denotes a change in the state of an object. If an object is in a certain state when an event occurs, the object may perform certain activities subject to specified conditions and change the state. In this case, a state−transition is said to have occurred. The transition gives the relationship between the first state and the new state. A transition is graphically represented by a solid directed arc from the source state to the destination state.
The five parts of a transition are −
Source State − The state affected by the transition.
Event Trigger − The occurrence due to which an object in the source state undergoes a transition if the guard condition is satisfied.
Guard Condition − A Boolean expression which if True, causes a transition on receiving the event trigger.
Action − An un-interruptible and atomic computation that occurs on the source object due to some event.
Target State − The destination state after completion of transition
Diagrams for Dynamic Modelling
There are two primary diagrams that are used for dynamic modelling −
Interaction Diagrams
Interaction diagrams describe the dynamic behavior among different objects. It comprises of a set of objects, their relationships, and the message that the objects send and receive. Thus, an interaction models the behavior of a group of interrelated objects. The two types of interaction diagrams are −
Sequence Diagram − It represents the temporal ordering of messages in a tabular manner.
Collaboration Diagram − It represents the structural organization of objects that send and receive messages through vertices and arcs.
State Transition Diagram
State transition diagrams or state machines describe the dynamic behavior of a single object. It illustrates the sequences of states that an object goes through in its lifetime, the transitions of the states, the events and conditions causing the transition and the responses due to the events.
Functional Modelling
Functional Modelling is the final component of object-oriented analysis. The functional model shows the processes that are performed within an object and how the data changes as it moves between methods. It specifies the meaning of the operations of object modelling and the actions of dynamic modelling. The functional model corresponds to the data flow diagram of traditional structured analysis.
The process of functional modelling can be visualized in the following steps −
Identify all the inputs and outputs
Construct data flow diagrams showing functional dependencies
State the purpose of each function
Identify constraints
Specify optimization criteria
Advantages/Disadvantages of Object Oriented Analysis
Scenario-based modeling
Technically there is no 'right way' to go through the stages of requirements modeling, it typically begins with scenario-based modeling, and that is because it identifies the possible use cases for the system and produces the use case diagram, to which all the other stages of requirements modeling .
In UML the scenario based modelling can be done by developing the scenarios in the form of use cases, activity diagram and swim lane diagrams. The use case diagram intended to capture the interaction between producer and consumer of the system. All the required functionalities can be exposed by creating the use case diagrams.
Activity Diagram: The activity diagram is a graphical representation for representing the flow of interaction within specific scenarios. It is similar to a flow chart in which various activities that can be performed in the system are represented. This diagram must be read from top to bottom. It consists of forks and branches. The fork is used to remember that many activities can be parallel carried out. This diagram also consists of merge, where multiple branches get combined. Before transitioning into final activity state there comes a join.
Swim lane Diagram: The activity diagram shows various activities performed, but it does not tell you who is responsible for these activities. In swim lane diagram the activity diagram is partitioned according to the class who is responsible for carrying out these activities.
Flow-oriented modeling:
Flow oriented modeling
The flow oriented modeling represents how data objects are transformed at they move through the system. Derived from structured analysis, flow models use the data flow diagram, a modeling notation that depicts how input is transformed into output as data objects move through the system. Each software function that transforms data is described by a process specification or narrative. In addition to data flow, this modeling element also depicts control flow.
Although flow oriented modeling is perceived as an outdated technique by some software engineers, it continues to be one of the most widely used requirements analysis notations in use today. Flow oriented modeling focuses on structured analysis and design, follows a top to down methodology and uses a graphical technique depicting information flows and the transformations that are applied as data moves from input to output.
The modeling tools that are used to build a data flow oriented model include context diagrams, data flow diagrams, entity relationship diagram, control flow diagram, state transition diagram, data dictionary, process specification and control specification. Although the data flow diagram (DFD) and related diagrams and information are not a formal part of UML (Unified Modeling Language), they can be used to complement UML diagrams and provide additional insight into system requirements and flow. The flow oriented modeling takes an input-process-output view of a system. That is, data objects flow into the software, are transformed by processing elements, and resultant data objects flow out of the software.
Data Flow Diagram:
The data flow diagram represents the flows of data between different process in a business. It is a graphical technique that depicts information flow and transforms that are applied as data from input to output. It provides a simple, intuitive method for describing business processes without focusing on the details of computer systems. DFDs are attractive techniques because they provide what users do rather than what computers do. In DFD, there are four symbols are used:
1. Process:

The circle represents the process. An activity that changes or transforms data flows. Since they transform incoming data to outgoing data, all processes must have inputs and outputs on a DFD.
2. Data Flow:
The labeled arrows indicate incoming and outgoing data flow. Movement of data between external entities, processes and data stores is represented with an arrow symbol, which indicates the direction of flow.
3. Data Store:
The rectangle represents an external entity. A data store does not generate any operations but simply holds data for later access.
4. External Entity:

In Data Flow Diagrams external entities produce and consume data that flows between the entity and the system being diagrammed.
These data flows are the inputs and outputs of the DFD. Data objects are represented by labeled arrows, and transformations are represented by circles. The DFD is presented in a hierarchical fashion. That is, the first data flow model (sometimes called a level 0 DFD or context diagram) represents the system as a whole. Subsequent data flow diagrams refine the context diagram, providing increasing detail with each subsequent level.
Class-based modeling:
Class-based modelling identifies classes, attributes and relationships that the system will use..
Class based modelling represents the object. The system manipulates the operations.
The elements of the class based model consist of classes and object, attributes, operations, class – responsibility - collaborator (CRC) models.
Classes
Classes are determined using underlining each noun or noun clause and enter it into the simple table.
Classes are found in following forms:
External entities: The system, people or the device generates the information that is used by the computer based system.
Things: The reports, displays, letter, signal are the part of the information domain or the problem.
Occurrences or events: A property transfer or the completion of a series or robot movements occurs in the context of the system operation.
Roles: The people like manager, engineer, and salesperson are interacting with the system.
Organizational units: The division, group, team are suitable for an application.
Places: The manufacturing floor or loading dock from the context of the problem and the overall function of the system.
Structures: The sensors, computers are defined a class of objects or related classes of objects.
Attributes: Attributes are the set of data objects that are defining a complete class within the context of the problem.
For example, 'employee' is a class and it consists of name, Id, department, designation and salary of the employee are the attributes.
Operations
The operations define the behaviour of an object.
The operations are characterized into following types:
The operations manipulate the data like adding, modifying, deleting and displaying etc.
The operations perform a computation.
The operation monitors the objects for the occurrence of controlling an event
CRC Modelling
The CRC stands for Class-Responsibility-Collaborator.
It provides a simple method for identifying and organizing the classes that are applicable to the system or product requirement.
Class is an object-oriented class name. It consists of information about sub classes and super class
Responsibilities are the attributes and operations that are related to the class.
Collaborations are identified and determined when a class can achieve each responsibility of it. If the class cannot identify itself, then it needs to interact with another class.
Creating behavior model:
Behavioral modeling: - It indicates how software will respond to external events or stimuli. In behavioral model, the behavior of the system is represented as a function of specific events and time.
To create behavioral model following things can be considered:
Evaluation of all use-cases to fully understand the sequence of interaction within the system.
Identification of events that drive the interaction sequence and understand how these events relate to specific classes.
Creating sequence for each use case.
Building state diagram for the system.
Reviewing the behavioral model to verify accuracy and consistency.
It describes interactions between objects. It shows how individual objects collaborate to achieve the behavior of the system as a whole. In UML behavior of a system is shown with the help of use case diagram, sequence diagram and activity diagram
A use case focuses on the functionality of a system i.e. what a system does for users. It shows interaction between the system and outside actors.
Ex: Student, librarians are actors, issue book use case.
A sequence diagram shows the objects that interact and the time sequence of their interactions.
Ex: Student, librarians are objects. Time sequence enquires for book check availability –with respect time.
An activity diagram specifies important processing steps. It shows operations required for processing steps. It shows operations required for processing.
Ex issue book, check availability does not show objects.
Comments
Post a Comment